Create a tile plot of membership data
Details
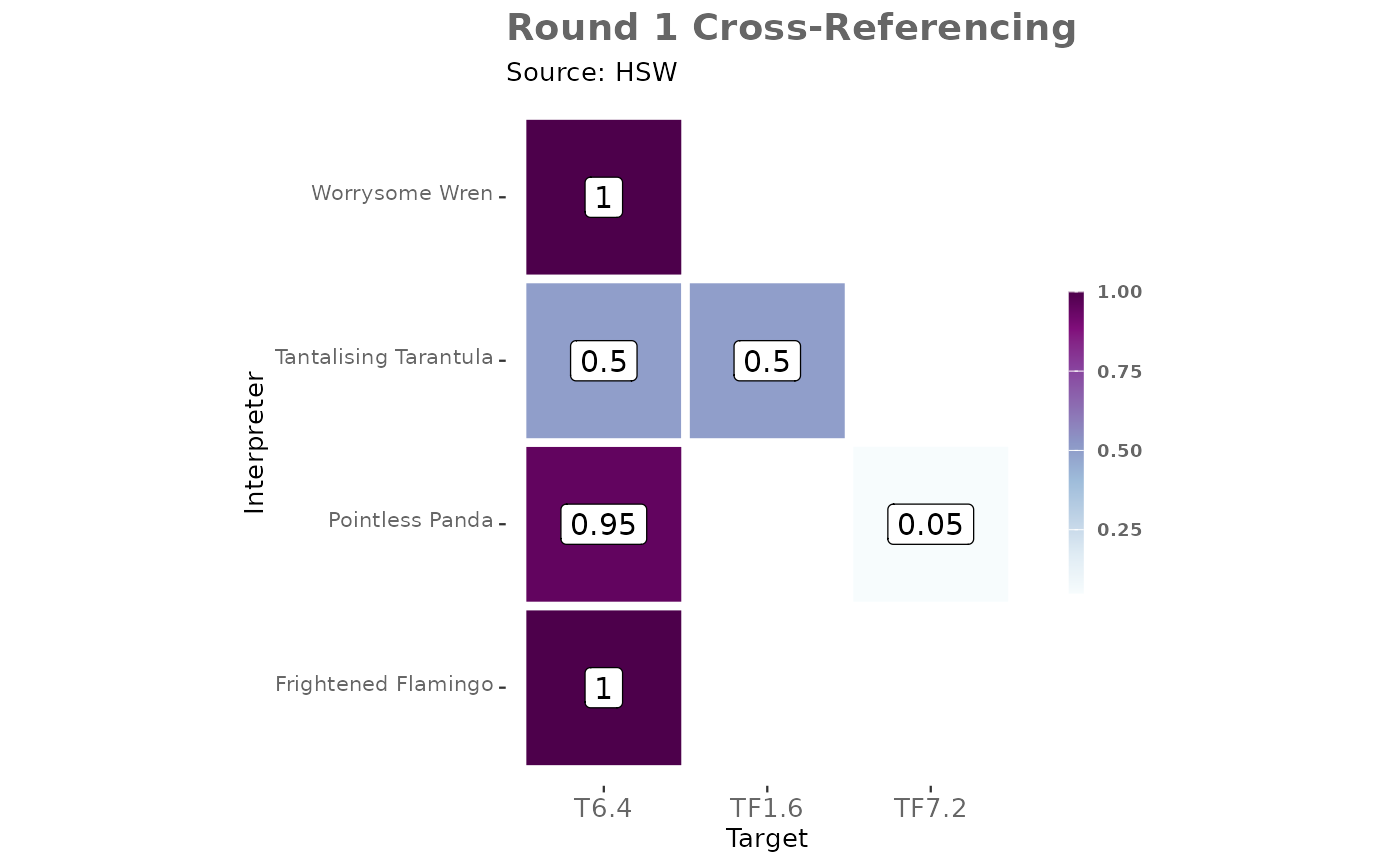
The data frame should include columns for interpreters, targets, and membership values. The function generates a tile plot where each tile represents the membership value for a specific interpreter-target pair. The tiles are colored according to the membership value, with a color gradient indicating the strength of membership. The plot also includes labels on each tile showing the rounded membership value.
Returns a tile plot of membership functions among interpreters for a single source for a single round of elicitation. The plot uses a color gradient to represent membership values, with tiles colored according to the membership value for each interpreter-target pair. The plot includes labels for each tile showing the rounded membership value.
Future Enhancements
The function is designed to be flexible and can be extended in the future to include additional customization options. Users may specify theme options, text color, label aesthetics, geom_tile options, axis labels, title, and subtitle to tailor the plot to their specific needs. These enhancements will allow for greater control over the visual presentation of the membership data.
See also
Other visualisation:
membership_target_heatmap(),
membership_target_pair_heatmap()
Examples
# Example usage with the [TASVEG_xref] dataset
data("TASVEG_xref")

# Create a tile plot for a specific source
TASVEG_xref |>
membership_tbl(
  source_id = "VEGCODE",
  target_id = "efg",
  membership = "memb",
  interpreter = "interp"
) |>
dplyr::filter(VEGCODE == "HSW") |>
  membership_tile_plot()