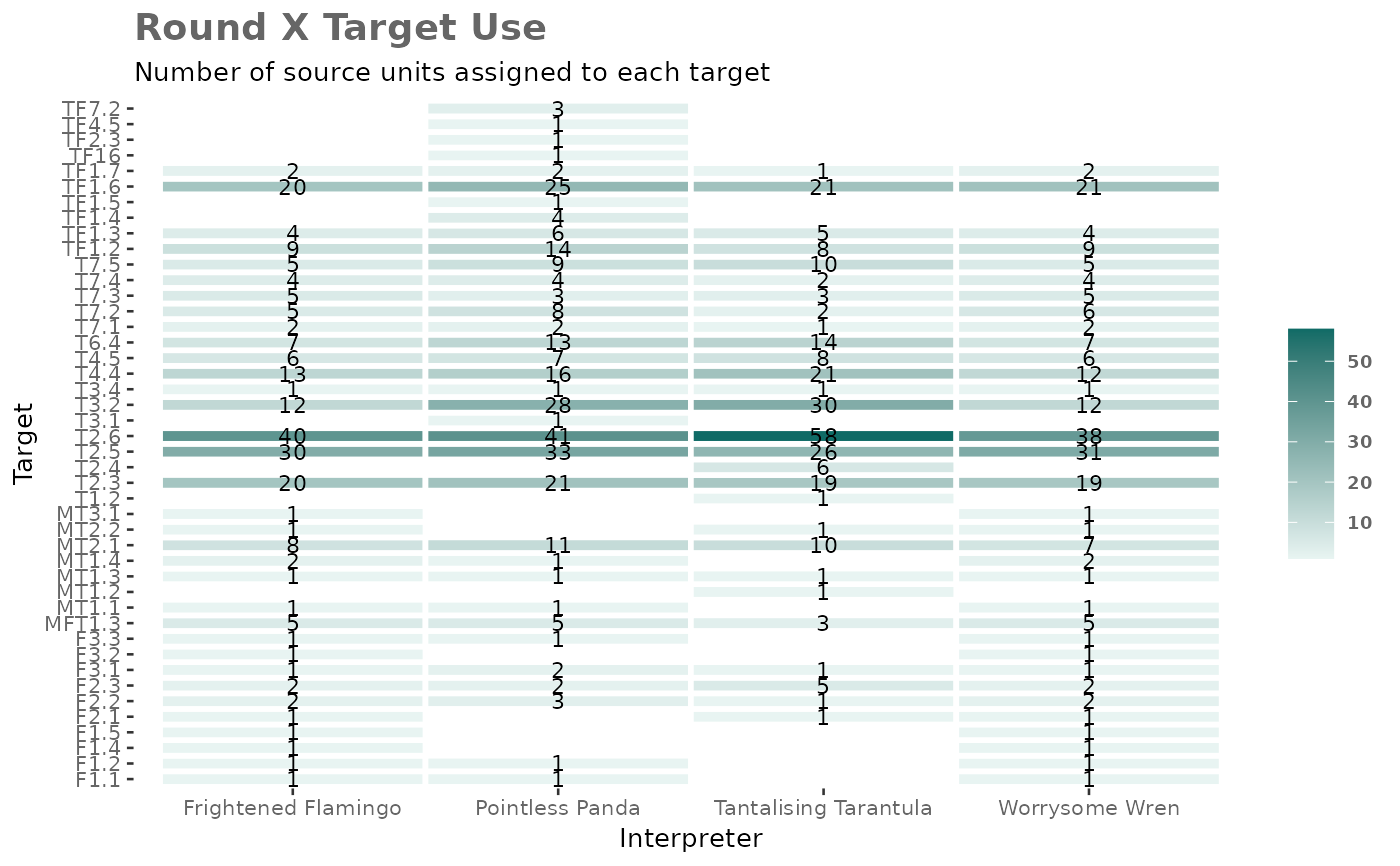
Create a heatmap of target use by interpreter
Source:R/membership_heatmap_plot.R
membership_target_heatmap.RdCreate a heatmap of target use by interpreter
Details
Returns a heatmap of how often each target is used by each interpreter, for a single round of elicitation. Each tile shows the number of source units an interpreter assigned to a target, with a colour gradient from light to dark teal for more source units. Empty tiles mean the interpreter never used that target. The plot helps to spot targets used by only one interpreter, which may indicate a difference in interpretation or a typo in the target id.
Future Enhancements
The function is designed to be flexible and can be extended in the future to include additional customization options. Users may filter by round of elicitation, show the sum of membership instead of the number of source units, and specify theme options, colour palette, label aesthetics, axis labels, title and subtitle to tailor the plot to their specific needs.
See also
Other visualisation:
membership_target_pair_heatmap(),
membership_tile_plot()
Examples
# Example usage with the TASVEG_xref dataset
data("TASVEG_xref")
TASVEG_memb <- membership_tbl(
  TASVEG_xref,
  source_id = "VEGCODE",
  target_id = "efg",
  membership = "memb",
  interpreter = "interp"
)
membership_target_heatmap(TASVEG_memb)